Ready to fill east coast gas void
Published 14-OCT-2015 00:00 A.M.
|
20 minute read
Hey! Looks like you have stumbled on the section of our website where we have archived articles from our old business model.
In 2019 the original founding team returned to run Next Investors, we changed our business model to only write about stocks we carefully research and are invested in for the long term.
The below articles were written under our previous business model. We have kept these articles online here for your reference.
Our new mission is to build a high performing ASX micro cap investment portfolio and share our research, analysis and investment strategy with our readers.
Click Here to View Latest Articles
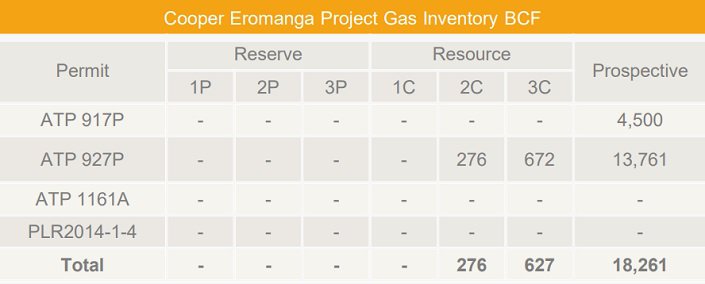
Overview: Real Energy Corporation Ltd ("Real Energy", "the Company") is an Australian energy company focused on oil and gas exploration in the Cooper-Eromanga Basins. Its assets incorporate four petroleum exploration permits covering a total area of 9,523km2 in Queensland’s southwest. Contingent resources of 276BCF (2C) and 672BCF (3C) have been identified. The licenses are estimated to potentially host undiscovered ‘prospective’ resources of 18,261BCF gas. Real Energy listed on the Australian Securities Exchange ("ASX") in December 2013.
Catalysts: Eastern Australia gas prices have doubled since 2011 and Real Energy is positioned to address a tightening supply landscape. Its first two exploration wells identified a large tight gas resource underlying one-third of its license holdings, and upcoming appraisal programs are designed to highlight the commercial potential of its Cooper-Eromanga Project. Successful, cost-effective stimulation, followed by a progression of Incitec Pivot discussions into a gas sales agreement is the driver's.
Hurdles: Real Energy is reliant on external capital and there is no guarantee it can procure the funding required to expedite commercial field development. Demonstrating commercial gas flows through stimulation involves significant technical risk and there is no guarantee it can be achieved at a reasonable cost. Weak international energy price indicators may challenge Real Energy’s capacity to attract fair value for its stock, despite firming east coast markets.
Investment View: Real Energy offers speculative exposure to domestic east coast gas demand. We are attracted to the scale of its license holdings, recent resource certification, its share register, and interest received from the major regional gas consumer, Incitec Pivot. With principal risks surrounding resource extractability, results of planned well stimulation activities are a major catalyst. With our valuation of $0.52/share representing a premium exceeding 350 percent to recent trade, the growth opportunity appears compelling and we initiate coverage with a ‘speculative buy’ recommendation.
COMPANY BACKGROUND
Real Energy Corporation Ltd ("Real Energy", "the Company") is an Australian energy company focused on oil and gas exploration in the Cooper-Eromanga Basins.
Its assets incorporate four petroleum exploration permits covering a total area of 9,523km2 in Queensland’s southwest. Whilst certified reserves remain to be defined, contingent resources of 276Billiion Cubic Feet (BCF) gas classified as 2C and 672BCF classified as 3C have been identified. The licenses are estimated to potentially host undiscovered ‘prospective’ resources of 18,261BCF gas.
Real Energy was incorporated in October 2009, and listed on the Australian Securities Exchange ("ASX") in December 2013. Issued capital currently stands at $24million, or $0.13/share.
ASSET OVERVIEW – COOPER EROMANGA PROJECT (100%)
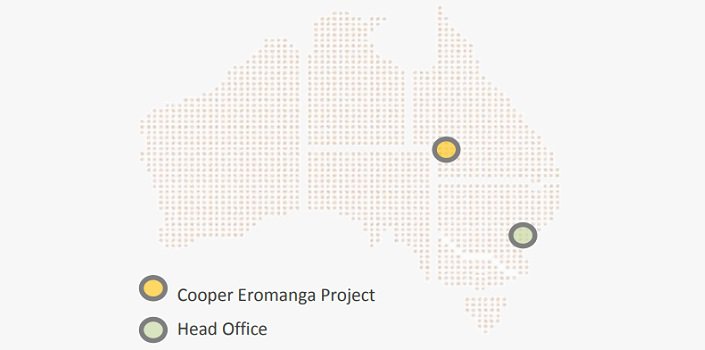
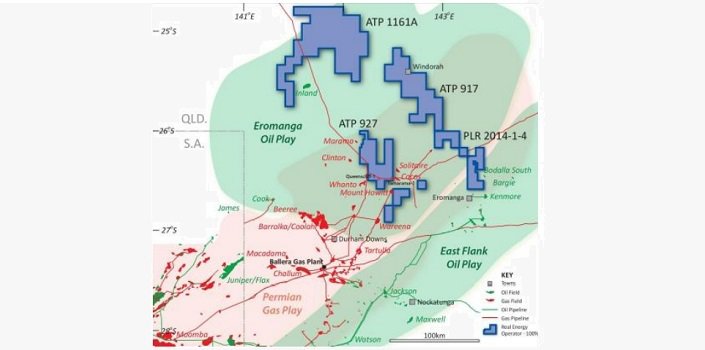
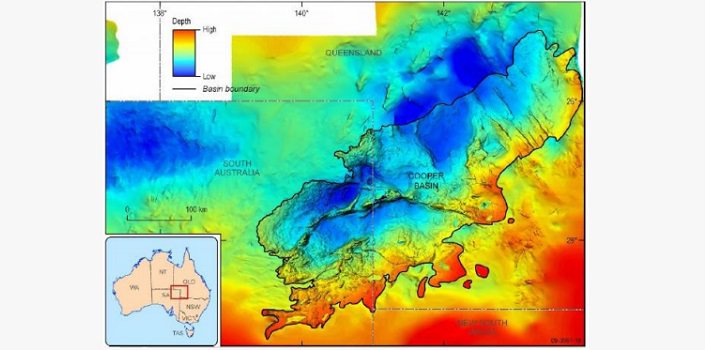
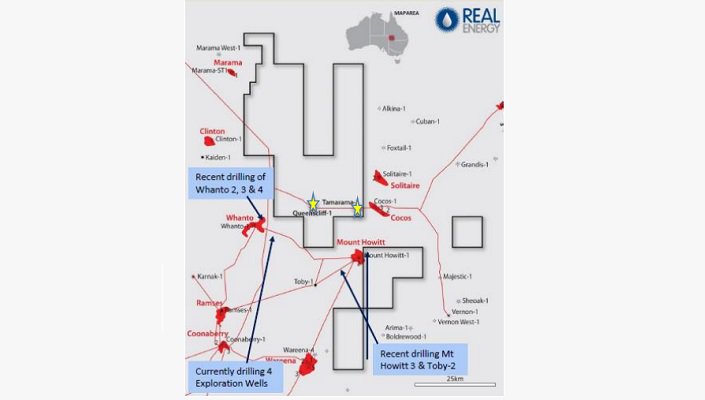
The Cooper Eromanga Project ("the Project") consists of four petroleum exploration licenses in Queensland’s southwest. Situated near the border with South Australia, the licenses straddle the townships of Eromanga, Windorah, and Durham, covering a total area of 9,523km2.
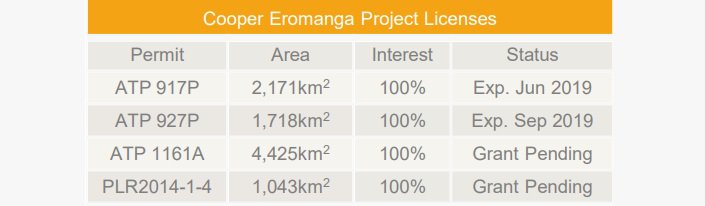
The licenses are wholly controlled by Real Energy. ATP917 and ATP927 were acquired from Drillsearch Energy (DLS.ASX) prior to the Company’s Initial Public Offer in 2013, and remain valid until 2019.
The Company has been selected by the Queensland State Government as the preferred tenderer for ATP1161A and PLR2014-1- 4, which remain subject to official grant.
Real Energy has defined contingent gas resources on ATP927. The 2C resource stands at 276BCF and the 3C estimate stands at 672BCF. Across the licenses, undiscovered ‘prospective’ resources total 18,261BCF.
The Project is accessible via 4WD and an airstrip is located nearby at Mt Howitt. Existing gas pipelines run through three of the four permits, connecting to the east coast gas markets.
BACKGROUND
Existing gas pipelines surrounding Real Energy’s licenses are in place to service the Cooper Basin’s prolific oil and gas industry. The Cooper Basin has been producing commercial hydrocarbons since the late 1960s.
It presently accounts for over 16 percent of national crude oil production and 12 percent of sales gas production. Over the past decade, crude oil output from the Cooper Basin has approximately doubled to 13.4million barrels, however, its sales gas output has declined significantly.
In the early 1980s, the Cooper Basin accounted for 40 percent of Australia’s sales gas production. However, with output contracting by more than half since 2000, the Cooper Basin’s gas output is now at the lowest levels since the area was first developed.
Cooper Basin used to deliver 40 per cent of Australia’s sales gas production
Impetus for change is driven by a combination of advancement in drilling technology and a structural shift in the dynamics impacting Australia’s east coast gas markets.
Scheduled to consume approximately five times more gas per annum than east coast domestic demand, four Liquified Natural Gas (LNG) plants due for commissioning in Queensland are poised to open up local markets to world-linked gas prices for the first time.
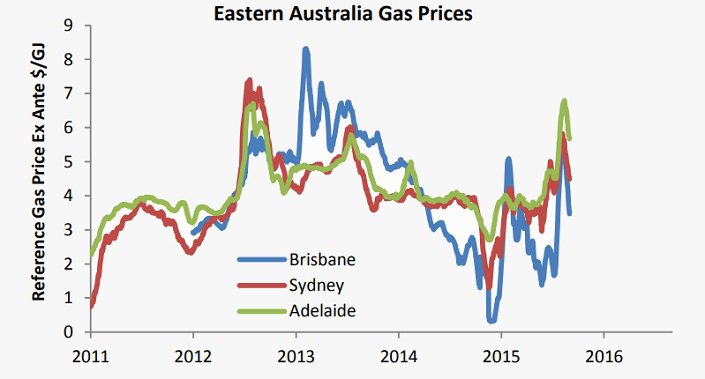
East Coast gas prices have doubled
Historically east coast domestic markets have been characterised by benign pricing, below regional benchmarks, however, dynamics have begun to shift.
Since 2011 indicator gas prices for major east coast markets have all firmed, with Sydney and Adelaide's benchmarks approximately doubling. Reprieve triggered by contracting world commodity prices in late 2014 appears to have been temporary.
Impetus to develop the Cooper Basin’s remaining gas inventory is therefore gaining momentum. Buoyed by a sustained period of elevated pricing, advancements in drilling technology paved the way to a more than doubling in Cooper Basin oil production since 2010.
The domestic gas pricing regime is now becoming conducive for the application of these technologies toward gas extraction. The US Energy Information Administration has estimated that the entire Cooper Basin has a risked recoverable shale gas resource of 85 Trillion Cubic Feet (TCF)1.
By comparison, the Cooper Basin’s cumulative gas production to date stands in the order of 7 TCF, with current output levels more than 60 percent below the peak witnessed 15 years earlier.
US EIA estimates the Cooper Basin’s remaining gas inventory to be 10 times greater than cumulative production to date
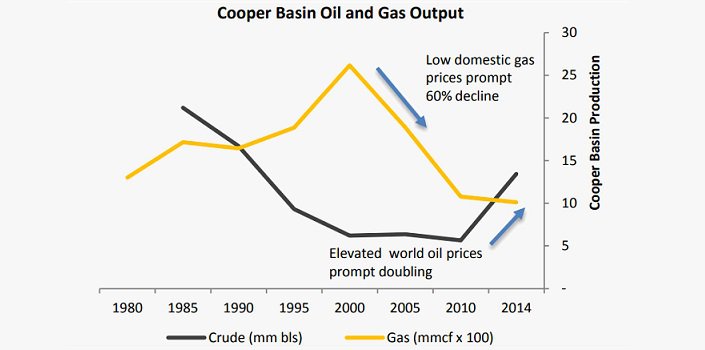
doubled since 2010, gas output has suffered a severe contraction. Source APPEA
Gas production trend could follow oil’s reversal
DEVELOPMENT STRATEGY
Since acquiring licenses underlying the Cooper Eromanga Project in 2013, Real Energy has focused on resource identification and estimation. Investment has been directed to ATP927, which has not previously been subject to exploration drilling.
Under exploration is characteristic of the Queensland section of the Cooper Basin where Real Energy is operating. Whilst 73 percent of the Cooper Basin is located in Queensland, the state has hosted less than 40 percent of wells drilled, with most attributed to the South Australian section2.
In conjunction with this thematic, and the benign domestic gas price regime prevailing at the time, the previous operators of ATP927 and ATP917 did not conduct any wells after procuring the permits as part of a larger package via Government tender in 2007.
Contingent resources of 276BCF in the 2C category and 672BCF in the 3C category have been defined following drilling in 2014
Real Energy commenced exploration on ATP927 in 2014. Two exploration wells have been drilled, both of which generated free flows of gas to the surface. The discovery facilitated the Cooper Eromanga Project’s first contingent resource estimate, which now totals 276BCF in the 2C category and 672BCF in the 3C category.
Real Energy estimates the geological formation hosting these resources extends throughout ATP927 and 60 percent of ATP917, however, its current focus is appraising the recoverability of the resource.
The Company has interpreted the resource to be ‘Tight’ / ’Basin Centered Gas’, which is generally hosted by sandstone, albeit with lower porosity than conventional gas.
Real Energy is therefore preparing a well stimulation program encompassing staged fracturing. Management estimates that initial flow rates of 2-3mmcf/day to be the threshold required to expedite further commercial development of the field.
Demonstrating flow rates of this magnitude at a reasonable cost would allow the Company to simultaneously – execute a gas sales agreement ("GSA"); upgrade existing contingent resources to the reserved category, and accelerate exploration across the Project.
LOI with Incitec Pivot for gas sales
A Letter of Intent ("LOI") has been executed with Incitec Pivot Ltd ("Incitec Pivot"; IPL.ASX), which consumes approximately 40PJ gas pa to support its domestic chemical and fertiliser processing activities. The LOI represents a precursor to an official GSA, and to a significant degree focuses the major development risks on recoverability and funding.
ECONOMICS
Execution of the existing well stimulation program is expected to cost $4million. If successful, Real Energy estimates commercial field development would require an outlay of approximately $4million - $5million per well, which includes fracturing and completion. Additional capital expenditure in the order of $25million is required to connect the field to existing pipelines.
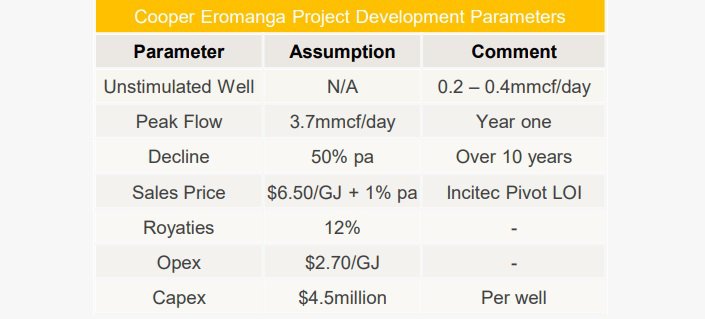
The major risks surround each well’s initial flow rate, subsequent rate of decline, and the potential for capital expenditures to exceed the budget. The Company estimates initial flow rates post-stimulation of 2-3mmcf/day are required to achieve breakeven.
Exploration wells, Tamarama-1,and Queenscliff-1, witnessed initial unstimulated flow rates in the order of 0.4mmcf/day and 0.2mmcf/day, respectively. Based on intelligence derived from the 300-400 wells fracture stimulated in the Cooper Basin to date, Real Energy is targeting flow rate benefits in the order of tenfold.
Well stimulation projections are based on results from 300- 400 fracture stimulated wells to date in the Cooper Basin
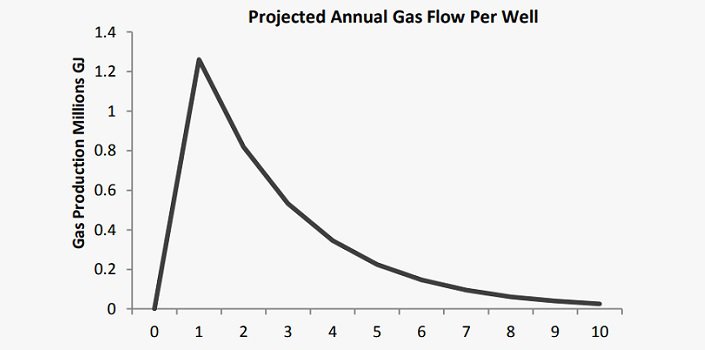
Based on existing data and management projections, we estimate individual well capital expenditures could be repaid within each well’s first year of production, and that 95 percent of well revenue is generated during its first four years of production.
Assuming stimulation activities are successful, existing contingent resources underlying Real Energy’s licenses have the potential to host in the order of 100-300 wells. The Incitec LOI envisages delivery of 11PJ gas per annum at market-linked prices.
Contingent resources could support 100-300 wells
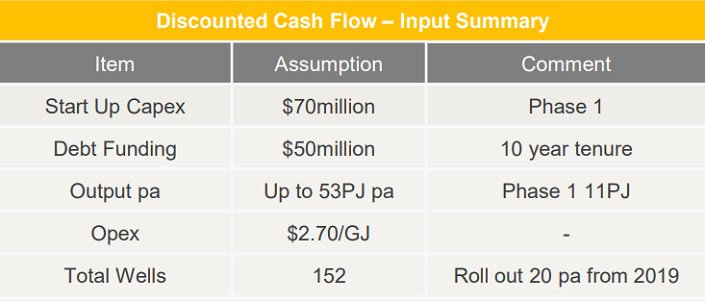
We understand expansion beyond this point would require Real Energy to construct its own processing facility at a capital outlay in the order of $75million.
FINANCIAL PERFORMANCE
As Real Energy’s assets are currently in the exploration phase, the Company does not presently generate revenue and is reliant on external capital to fund operations.
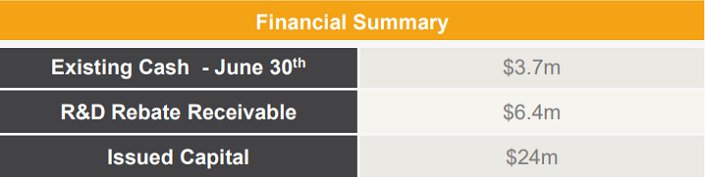
During FY15, Real Energy expended $13.75million on exploration and development. From these activities, a $6.4million Federal Government Research and Development tax incentive rebate has been lodged and is currently classified as receivable. As of June 30, its cash position was $3.7million.
[callout class="center_callout" layout="layout_one" title="$6.4m R&D rebate pending" imgsrc="https://wise-owl.com/uploads/2021/01/Graph-Icon_1.jpg"][/callout]
To date, Real Energy has financed operations via equity. Its most recent fundraising exercise was the December 2013 Initial Public Offer, which raised $10million at $0.25/share, expending shares outstanding by 24 percent. Issued capital currently stands at $24million, or $0.13/share.
VALUATION
Real Energy’s investment appeal rests in the development potential of its Cooper Eromanga Project and the scale of its license holdings.
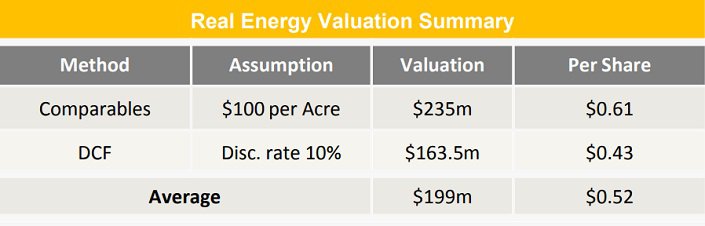
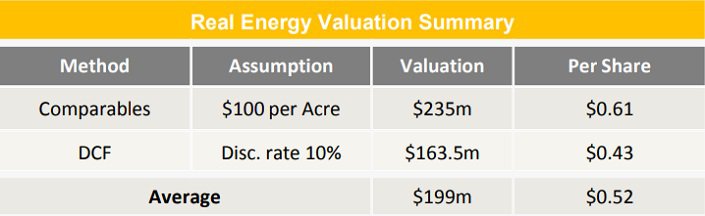
We have considered the Company’s potential worth using a Comparables approach and Discounted Cash Flow ("DCF") methodologies. Our appraisal is based on an expanded share count of 384million, reflecting an additional equity funding demand of circa $19million.
Valuation $0.52/share
Our Comparables approach arrives at a valuation of $235million, or $0.61/share. Our DCF method arrives at a valuation of $163.5million, or $0.43/share Applying equal weightings both methods deliver an aggregate valuation of $199million or $0.52/share.
Comparables Method
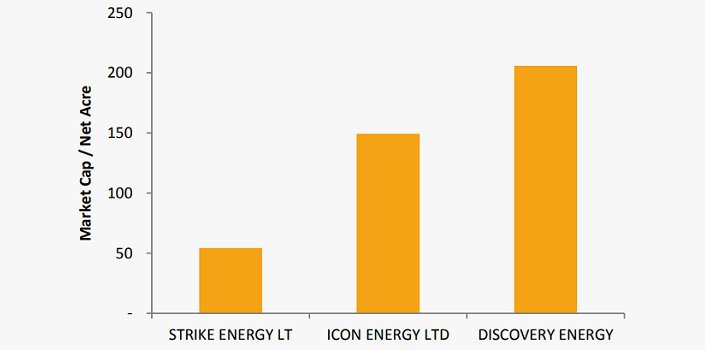
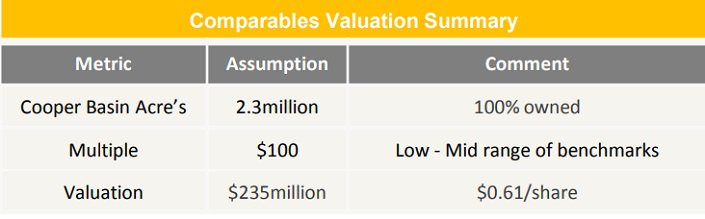
A universe of comparable companies has been assembled which are principally engaged in oil and gas exploration in the Cooper Basin. There are three relevant data points, which have been considered based on the scale of their license holdings.
Largest acreage position of Cooper Basin explorers
On a net acreage basis, valuation multiples range from $50 per acre to $200 per acre. To Real Energy’s 9,523km2 (2.3million acre holding, we have applied a low to a mid-range multiple of $100/acre to arrive at a comparables valuation of $235million or $0.61/share.
Discounted Cash Flow Method
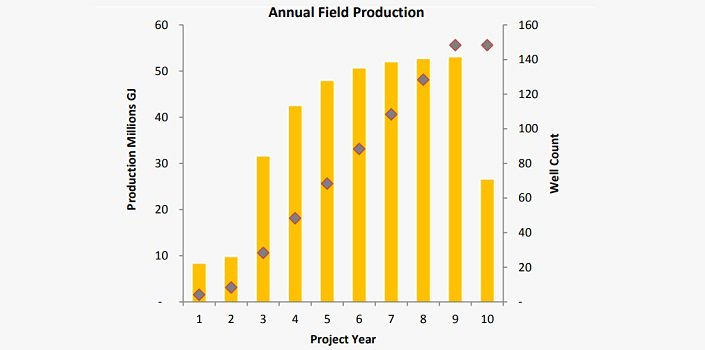
We have modeled the staged development of Real Energy’s Cooper Eromanga Project for over ten years. Our projections assume the Company’s upcoming well stimulation program demonstrates commercially robust gas flow, and that from 2017 approximately 4 wells per annum are initially developed to supply the Incitec Pivot LOI.
The model assumes each well flows gas at a rate of 3.7mmcf/day and oil at a rate of 30bls/day during its first 12 months and subsequently declines at a rate of 50 percent pa. Consistent with terms of the Incitec Pivot LOI, gas sales are projected at $6.50/GJ, escalating at 1 percent pa.
From 2019, we have modeled a phase 2 expansion involving the construction of dedicated processing facilities to support a higher development rate of 20 wells pa.
Over the ten-year projection period, cumulative production represents 56 percent of Real Energy’s contingent resources in the 3C category. The potential for Real Energy to further expand its resource base, project life, and output profile has not been taken into account. A terminal value has not been applied.
DCF only incorporates 53% of 3C resource
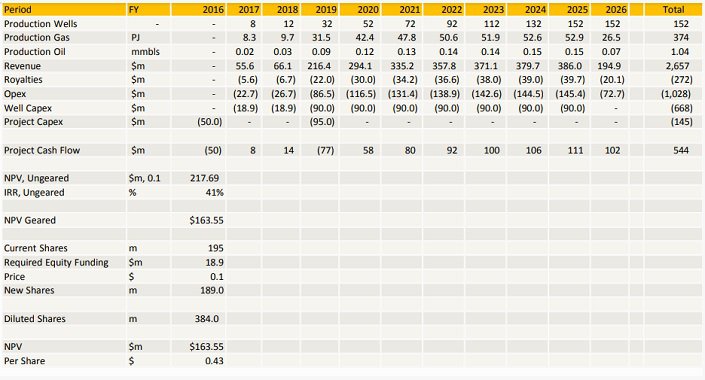
We have assumed the expansion to be debt-funded, adding to a $50million start-up project finance facility to be executed in 2016. The balance of development capital is assumed to be equity funded.
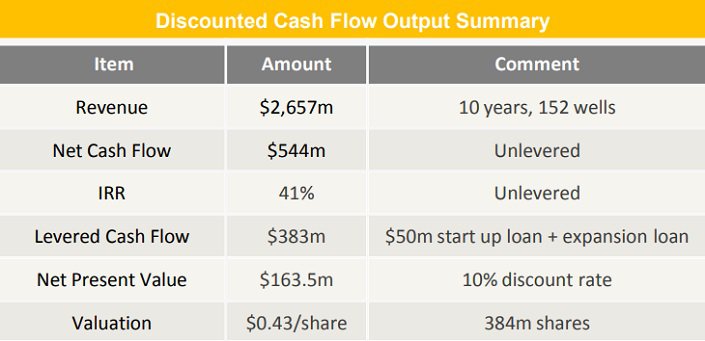
Our model projects gross revenues of $2,657million over the project life and a net cash flow of $544million. On an unlevered basis, the Internal Rate of Return (IRR) is estimated to be 41 percent.
Post debt servicing, we estimate the Net Present Value to be $163.5million. Whilst positive stimulation results may allow the Company to procure the required equity funding at a premium to current levels, for the sake of conservatism we have assumed an issue price of $0.10/share for the equity component.
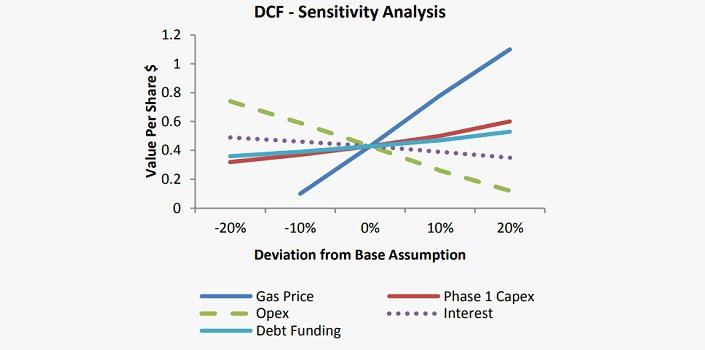
On a per share basis, the DCF arrives at a valuation of $0.43/share. The valuation is most sensitive to fluctuations in the gas price, with every 10 percent increase in the gas price assumption boosting the valuation by 80 percent.
INVESTMENT VIEW
Real Energy offers speculative exposure to domestic east coast gas demand. We are attracted to the scale of its license holdings, recent resource certification, management track record, the strength of its share register, funding position, interest received from the major regional gas consumers, Incitec Pivot, and thematics driving east coast gas markets.
Principal risks surround the Company’s ability to enhance existing unstimulated gas flow via hydraulic fracturing, the associated costs, and the availability of subsequent development capital.
Well stimulation results are the major driver
Results of planned well stimulation activities are therefore a major catalyst, likely to highlight the broader commercial potential of Real Energy’s license holdings. In the event of favourable technical appraisals, we expect the Company’s institutionally orientated share register and nominated off-take partner could mitigate funding risks.
Our valuation of $0.52/share represents a premium exceeding 350 percent to recent trade and does not incorporate potential upside from increased project life and production capacity which further exploration could deliver. Representing a compelling growth opportunity, we initiate coverage with a ‘speculative buy’ recommendation.
MANAGEMENT
LAN NGUYEN - NON EXECUTIVE CHAIRMAN
Mr. Lan Nguyen holds a Bachelor of Science (mining engineer- geologist) degree majoring in petroleum exploration from the Institute of Oil and Chemistry, Baku, Azerbaijan, and a Master of Science degree in petroleum geology from the University of New England, Australia. He is a member of the Petroleum Exploration Society of Australia (PESA), the American Association of Petroleum Geologists (AAPG), and the Society of Petroleum Engineers (SPE).
Lan is a professional petroleum geologist and engineer with over 20 years of experience in petroleum exploration, development, and production in Australia and internationally including 15 years at Mosaic Oil N.L. (‘Mosaic’), an ASX listed petroleum exploration and production company, where he played a leading role, initially in technical and technical management positions and in the last 4 years, as Managing Director, in transforming Mosaic from a speculative petroleum explorer to a successful petroleum exploration and production company with growing production revenues, petroleum reserves/resources, and profitability.
Lan is currently a principal/director of Tanvinh Resources Pty Ltd and chairman of Cube Gas Pty Ltd He is also a Non-executive Director of Ardent Resources Limited (ASX:AWO).
SCOTT BROWN - MANAGING DIRECTOR
Mr. Scott Brown holds a Bachelor of Business and a Master of Commerce and is a member of the Institute of Chartered Accountants and the Petroleum Exploration Society of Australia (PESA). Scott is the Chief Executive Officer and co-founder of Real Energy Corporation Limited. Prior to this, he was the Chief Financial Officer of Mosaic Oil NL (ASX: MOS), a listed petroleum production and exploration company with an extensive range of oil and gas production and exploration permits in Queensland, New Zealand, and offshore WA. He is also Chairman of Adrent Resources Limited.
During his time with Mosaic, he was involved in the acquisition of production properties and the growth of its business and profitability. He was instrumental in putting together a Scheme of Arrangement with AGL Energy Ltd to acquire Mosaic for consideration of $142 Million.
Scott was also formerly the Chief Financial Officer and Company Secretary with a number of public companies including Turnbull & Partners Limited, Allegiance Mining NL, FTR Holdings Limited and Garratt’s Limited. Scott also worked at accounting firms, Ernst Young and KPMG.
NORMAN ZILLMAN - NON EXECUTIVE DIRECTOR
Mr. Norman Zillman is a professional geologist and a member of the Australasian Institute of Mining and Metallurgy (Aust.I.M.M) and the Petroleum Exploration Society of Australia (PESA).
Norm has over 45 years’ experience in minerals, petroleum, coal, coal bed methane, and geothermal exploration and production in Australia and internationally. His initial experience was as a petroleum geologist with international companies Aquitaine Petroleum in Australia and Papua New Guinea and Union Oil Company of California in Australia and Indonesia.
More recently, Norm has been responsible for a number of successful public resource floats on the ASX. He was the inaugural Managing Director and a co-founder of Coal Bed Methane (CBM) company Queensland Gas Company Ltd (QGC), being responsible for the initial acquisition of all of its areas, the successful floating on the ASX, and the discovery of QGC’s first CBM gas field, Argyle.
RISKS
Technical Risk
There is no guarantee Real Energy’s well stimulation program will achieve commercial flow rates, or at a cost that justifies further development of the Cooper Eromanga Project. There is no guarantee the Project hosts sufficient additional resources to support Real Energy’s proposed field development, or that they can be converted into Reserves.Competitive Risk
There are multiple oil and gas developers operating in the Cooper Basin, generating competition for funding, services, and expertise. Real Energy may face challenges distinguishing itself from other operators in the area or fall subject to an opportunistic takeover below fair value.Market Risk
Whilst domestic gas markets have demonstrated robustness, there is no guarantee that they will remain insulated from recent contraction in prices for world energy commodities. There is a risk that recent strengthening domestic prices stimulate new supply, threatening the longer-term revenue potential of Real Energy’s Cooper Eromanga Project.Supply Chain Risk
For Phase 1 development of its Cooper Eromanga Project, Real Energy is likely to rely on midstream processing facilities owned and operated by third parties. Therefore, uncontrollable service interruptions and capacity restrictions are a risk.Funding Risk
Real Energy is reliant on external capital and there is no guarantee it can procure the necessary funding required to advance the Cooper Eromanga Project into production.Valuation Risk
The valuation is contingent on Real Energy exceeding commercially robust flow rates across the Cooper Eromanga Project, in areas currently absent of defined reserves. Failure to meet these hurdles or execute within the specified budget would adversely impact the valuation per share.
THE BULLS AND THE BEARS
THE BULLS SAY
- East coast gas markets are undergoing structural change, resulting in stronger prices
- The first two wells at Real Energy’s Cooper Eromanga Project have resulted in gas discoveries, allowing the Company to delineate contingent resources
- LOI with Incitec Pivot highlights the market opportunity should
- Real Energy demonstrate the commerciality of the project
- Execution of a well stimulation program is expected to highlight the Project’s commercial development potential, representing a major catalyst
- Our valuation represents a substantial premium to recent trade
THE BEARS SAY
- Weak global energy prices may depress interest and constrain funding for Real Energy
- With the Cooper Eromanga Project regarded as a ‘tight gas’ play, extraction rather than identification of the resource represents the major hurdle
- The LOI is non-binding and is subject to Real Energy procuring necessary funding to advance Project development
- Whilst Real Energy’s well stimulation program utilises intelligence from 200-300 precedents in the Cooper Basin, there are major risks surrounding resulting flow rates and required capital expenditures
- The valuation is contingent on the well stimulation program achieving a significant degree of success, and that results can be replicated across the license area – where no contingent resources or reserves have been delineated
APPENDIX – DISCOUNTED CASH FLOW
1. World Shale Gas Resources: An Initial Assessment of 14 Regions Outside the United States. US Energy Information Administration, April 2011, Chapter 14, Australia.2. APPEA.
General Information Only
S3 Consortium Pty Ltd (S3, ‘we’, ‘us’, ‘our’) (CAR No. 433913) is a corporate authorised representative of LeMessurier Securities Pty Ltd (AFSL No. 296877). The information contained in this article is general information and is for informational purposes only. Any advice is general advice only. Any advice contained in this article does not constitute personal advice and S3 has not taken into consideration your personal objectives, financial situation or needs. Please seek your own independent professional advice before making any financial investment decision. Those persons acting upon information contained in this article do so entirely at their own risk.
Conflicts of Interest Notice
S3 and its associated entities may hold investments in companies featured in its articles, including through being paid in the securities of the companies we provide commentary on. We disclose the securities held in relation to a particular company that we provide commentary on. Refer to our Disclosure Policy for information on our self-imposed trading blackouts, hold conditions and de-risking (sell conditions) which seek to mitigate against any potential conflicts of interest.
Publication Notice and Disclaimer
The information contained in this article is current as at the publication date. At the time of publishing, the information contained in this article is based on sources which are available in the public domain that we consider to be reliable, and our own analysis of those sources. The views of the author may not reflect the views of the AFSL holder. Any decision by you to purchase securities in the companies featured in this article should be done so after you have sought your own independent professional advice regarding this information and made your own inquiries as to the validity of any information in this article.
Any forward-looking statements contained in this article are not guarantees or predictions of future performance, and involve known and unknown risks, uncertainties and other factors, many of which are beyond our control, and which may cause actual results or performance of companies featured to differ materially from those expressed in the statements contained in this article. S3 cannot and does not give any assurance that the results or performance expressed or implied by any forward-looking statements contained in this article will actually occur and readers are cautioned not to put undue reliance on forward-looking statements.
This article may include references to our past investing performance. Past performance is not a reliable indicator of our future investing performance.